

Blog
Engineering notes, product news and field reports from the team building the telemetry lake.
632 articles · 53 topics
- All 632
- Observability 94
- Logging 91
- Security 69
- DevOps & IT operations 57
- Product 54
- Tutorials 51
- AI 44
- Company news 38
- Monitoring 34
- AWS 32
- Metrics 31
- Tracing 16
41 more topics
- Real user monitoring 16
- CI/CD 15
- Kubernetes 14
- OpenTelemetry 13
- Application performance monitoring 13
- APM 12
- Alerts 12
- Olly 10
- SRE 10
- Gaming 10
- Data 10
- DataPrime 10
- Software development 10
- Troubleshooting 9
- Performance 8
- Security advisory 8
- Cloud 8
- Uncategorized 7
- FinOps 6
- Microservices 6
- Dataspaces & Datasets 5
- Log analytics 5
- Fintech 5
- Infrastructure monitoring 4
- Data Engine 4
- Compliance 4
- Logs 4
- Elasticsearch 4
- Migrations 3
- Cases 3
- Service Management 3
- Extensions 3
- IaC 3
- Explore 2
- Case studies 2
- CDN monitoring 2
- CloudWatch 2
- Java 1
- SIEM 1
- MDR 1
- Audit logs 1
 LoggingThe Value of Ingesting Firewall LogsIngesting firewall logs can assist in identifying security breaches, incorrectly configured applications, bad user behavior, badly configured networks, and more.
 AWSChoosing the Best AWS Serverless Computing SolutionEach serverless computing solution has different features and their own set of advantages and disadvantages, so it’s important to have a clear understanding of what you need before getting started.
 ProductUsing Coralogix to Gain Insights From Your FortiGate LogsFortiGate helps you understand what is happening on your network, and informs you about certain network activities. Learn how Coralogix can provide additional analytics and insights for your FortiGate logs.
 DevOps & IT operationsUnderstanding the Execution Context in JavaScriptA firm understanding of the execution context in JavaScript will help you comprehend more complex concepts such as hoisting and closure.
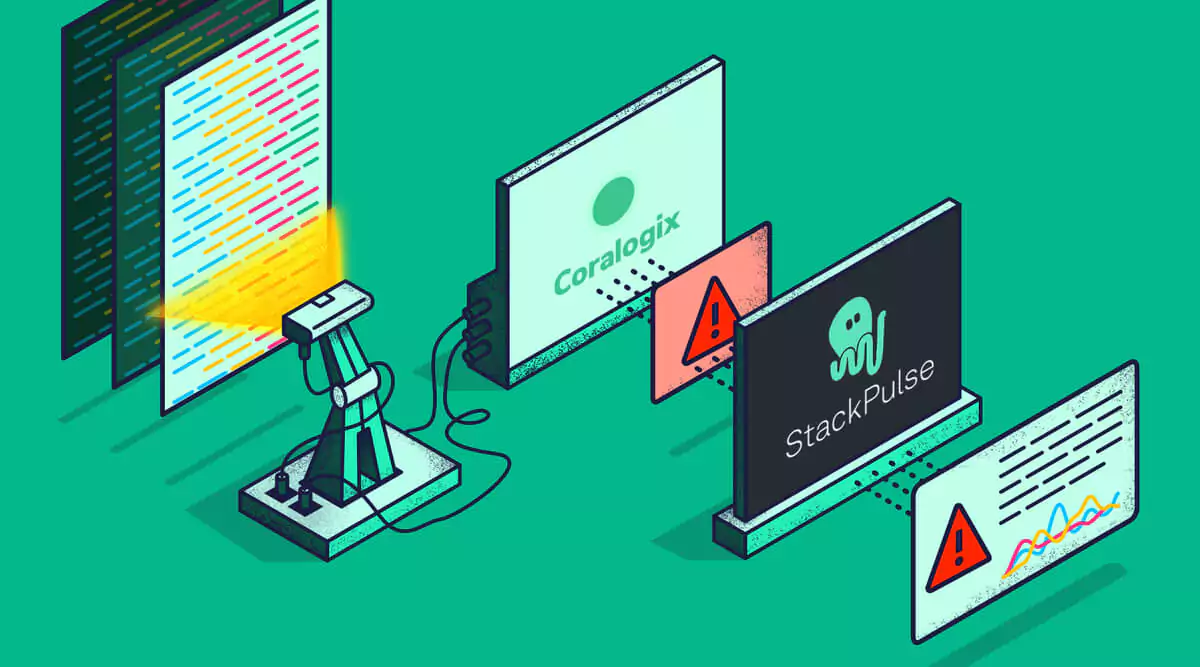 ProductUsing Coralogix + StackPulse to Automatically Enrich Alerts and Manage IncidentsLearn how StackPulse and Coralogix can be used together to automatically enrich alerts for faster and better incident management.
 MonitoringWhy You Need to Closely Monitor Your Exchange Servers
 DevOps & IT operationsWeb Assembly Deep Dive - How it Works, And Is It The Future?Since November 2017, Web Assembly has been supported in all major browsers, and even mobile web browsers for iOS and Android.
 SecurityWhat's the Most Powerful Tool in Your Security Arsenal?This post examines the security tools landscape and will help you understand which tools you should be investing in.
 DevOps & IT operationsHow Netflix Uses Fault Injection To Truly Understand Their Resilience
 DevOps & IT operationsUsing NoSQL Databases as Backend Storage for GrafanaGrafana is a powerful tool for visualizations and analysis, let's look at how we can connect NoSQL systems to Grafana as data sources.
 ObservabilityUnlocking Hidden Business Observability with Holistic Data CollectionHolistic data collectors in your observability stack grant broader visibility into what’s happening, why, and what the business impact is.
 TutorialsFlux Tutorial: Implementing Continuous Integration Into Your Kubernetes ClusterThis hands-on Flux tutorial explores how Flux can be used at the end of your continuous integration pipeline to deploy your applications to Kubernetes clusters.
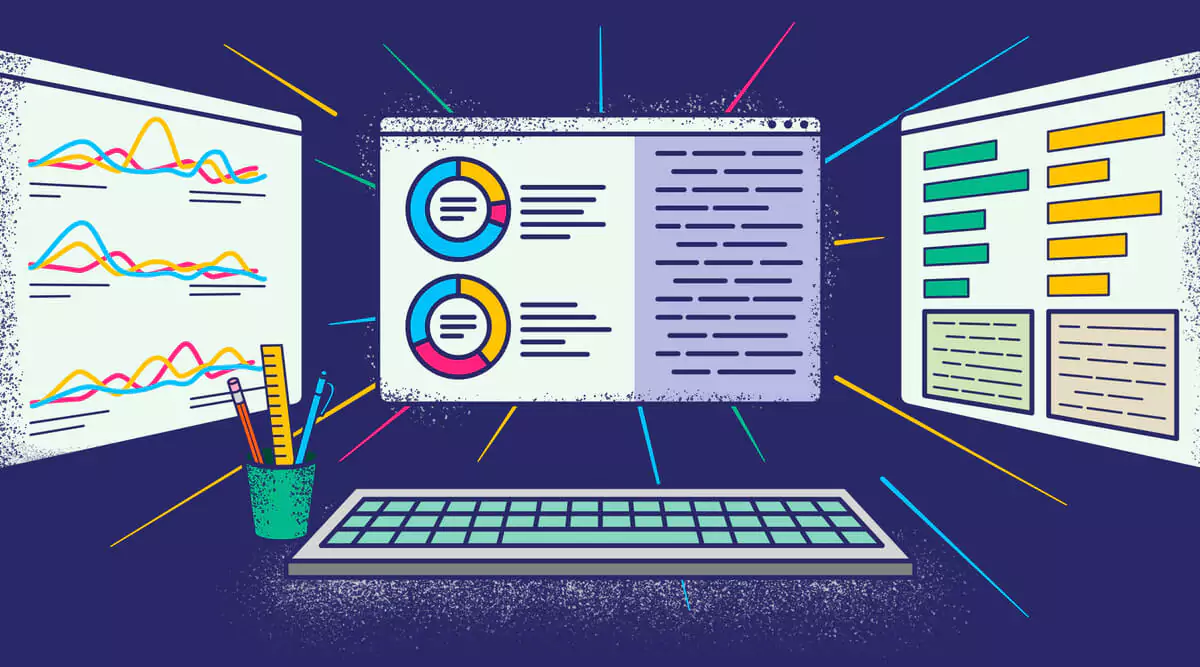 MetricsThe Untapped Power of Key Marketing MetricsThis post covers which marketing metrics you should monitor, and how to correlate them with technical measurements for broader observability.
 LoggingHow to Optimize Your Elasticsearch Queries Using PaginationIf you have so much data in your index that your API Gateway can't handle it all at once, paginate your query results for optimal performance.
 DevOps & IT operationsThe Importance of Communication in Software Development TeamsProgramming can be thought of as individual problem solving, but good communication is the cornerstone of successful software development.
 MonitoringWhat to Consider When Monitoring Hybrid Cloud ArchitectureHybrid cloud architectures provide greater flexibility, but they have their own unique monitoring challenges.
 TutorialsPromQL Tutorial: 5 Tricks to Become a Prometheus GodThis PromQL tutorial will show you 5 tips for mastering Prometheus. Using these tricks will allow you to get the most out of Prometheus.
 Observability5 Technical Metrics You Need for Observability in MarketingTying technical metrics to metrics measuring user engagement on your website are crucial for observability in marketing.
 MonitoringWhy Your Mean Time to Repair (MTTR) Is Higher Than It Should BeGiven the direct impact of system downtime on productivity, profitability and customer confidence, our understanding of MTTR is essential.
 DevOps & IT operationsBasic Principles of Kanban Software DevelopmentKanban software development focuses on project visualization using boards in order to increase project transparency and team collaboration.
 TroubleshootingMore Changes Mean More Challenges for TroubleshootingOn the face of it, the ability to make more software is a positive mark in the ledger. But with new abilities come new issues to solve.
 TutorialsMetricbeat Deep Dive: Hands-On Metricbeat Configuration PracticeIn this post, we will cover some of the main use cases Metricbeat supports and we will examine various Metricbeat configuration use cases.
 Cloud11 Tips for Avoiding Cloud Vendor Lock-InThis article will explore 11 key factors that an organization should consider in order to mitigate cloud vendor lock-in.
 DevOps & IT operationsDevSecOps vs DevOps: What are the Differences?In this piece, we’ll examine the differences in DevOps vs DevSecOps and quantify their respective impacts on your engineers.
No article matches that.