

Performance
Performance from Coralogix: 8 articles on performance.
8 articles · 53 topics
- All 631
- Observability 93
- Logging 91
- Security 69
- DevOps & IT operations 57
- Product 54
- Tutorials 51
- AI 43
- Company news 38
- Monitoring 34
- AWS 32
- Metrics 31
- Tracing 16
- Performance 8
41 more topics
- Real user monitoring 16
- CI/CD 15
- Kubernetes 14
- OpenTelemetry 13
- Application performance monitoring 13
- APM 12
- Alerts 12
- Olly 10
- SRE 10
- Gaming 10
- Data 10
- DataPrime 10
- Software development 10
- Troubleshooting 9
- Performance 8
- Security advisory 8
- Cloud 8
- Uncategorized 7
- FinOps 6
- Microservices 6
- Dataspaces & Datasets 5
- Log analytics 5
- Fintech 5
- Infrastructure monitoring 4
- Data Engine 4
- Compliance 4
- Logs 4
- Elasticsearch 4
- Migrations 3
- Cases 3
- Service Management 3
- Extensions 3
- IaC 3
- Explore 2
- Case studies 2
- CDN monitoring 2
- CloudWatch 2
- Java 1
- SIEM 1
- MDR 1
- Audit logs 1
 OpenTelemetryReal-Time Database Monitoring: Solving Database Latency with Zero-Code eBPF TracingDiscover how shifting database monitoring to the Linux kernel with eBPF captures deep protocol-aware insights and traces without a single code change or sidecar.
 AIWhat "AI-Ready Data" actually means for observability teams
 ObservabilityThe End of Manual Instrumentation: Scaling Observability with OTel OBI & CoralogixThis post is the first in a two-part series exploring how eBPF technology eliminates these hurdles. In this first installment, we examine the strategic shift from manual instrumentation to the "zero-code" automation provided by Coralogix OBI (OpenTelemetry eBPF-based instrumentation).
 AIIntroducing “Explain Flame Graph”: Stop Fighting Fires and Start Explaining ThemMost observability tools stop at visualization, leaving developers to "fight fires" by manually chasing stack traces. Our new Explain Flame Graph capability shifts the burden of analysis from the human to the platform—democratizing performance profiling for every engineer, regardless of expertise.
 MetricsDORA Metrics for $0.02 a day
 AWSUsing AWS Timestream for System Health MonitoringAWS Timestream was configured for efficient, cost-effective, and scalable time-series logging and analysis.
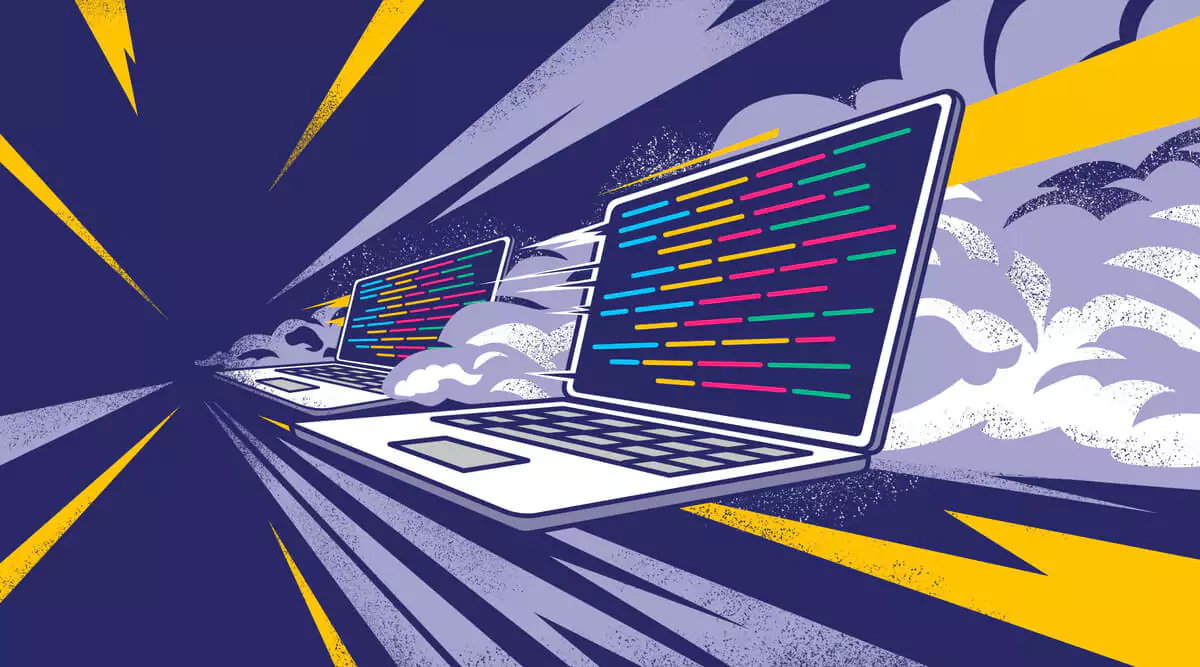 DevOps & IT operationsCommon Pitfalls in Maintaining Speed of Software DevelopmentThere's more to maintaining speed of software development than any individual developers’s abilities. Let’s explore this a bit.
No article matches that.