Every error has a price
One dataset holds your errors and your conversion, so you can see which release cost you users, and how many.


Heatmaps, funnels, and pathways from the RUM data you already send.
14 days, all features, no credit card required.
One dataset holds your errors and your conversion, so you can see which release cost you users, and how many.
Every statistic opens the users it counted. Replay one session, or export the whole list.
Product Analytics reads the sessions, views, and actions your RUM SDK already sends, so it populates on its own.
Click maps, scroll maps, and the ten most-clicked elements, drawn on a real picture of the page as it looked that day. Rage clicks are flagged on the spot, so a broken promo button stands out on its own.
Read the docsRage clicks and dead clicks are flagged automatically, alongside every other interaction on the page, so a broken Place order button, or a product name that looks like a link, surfaces without you going looking for it.
Read the docsSteps are pages, clicks, or your own events, counted by session or by unique user. Filter one step or the whole funnel by browser, device, or country, and every step tells you how many users it lost.
Read the docsPick one page, then follow where users went next or where they came from, up to seven steps in either direction. Use it to find a flow rather than measure one you already know.
Read the docsIn one click, navigate from high-level user pathways, heatmaps, or funnels to extreme granularity, with the Coralogix Real User Monitoring product.
Read the docsBrowser, iOS, and Android, from the RUM SDK you already run. Sampling, filtering, and redaction happen on the device, so sensitive fields never leave it.
Read the docs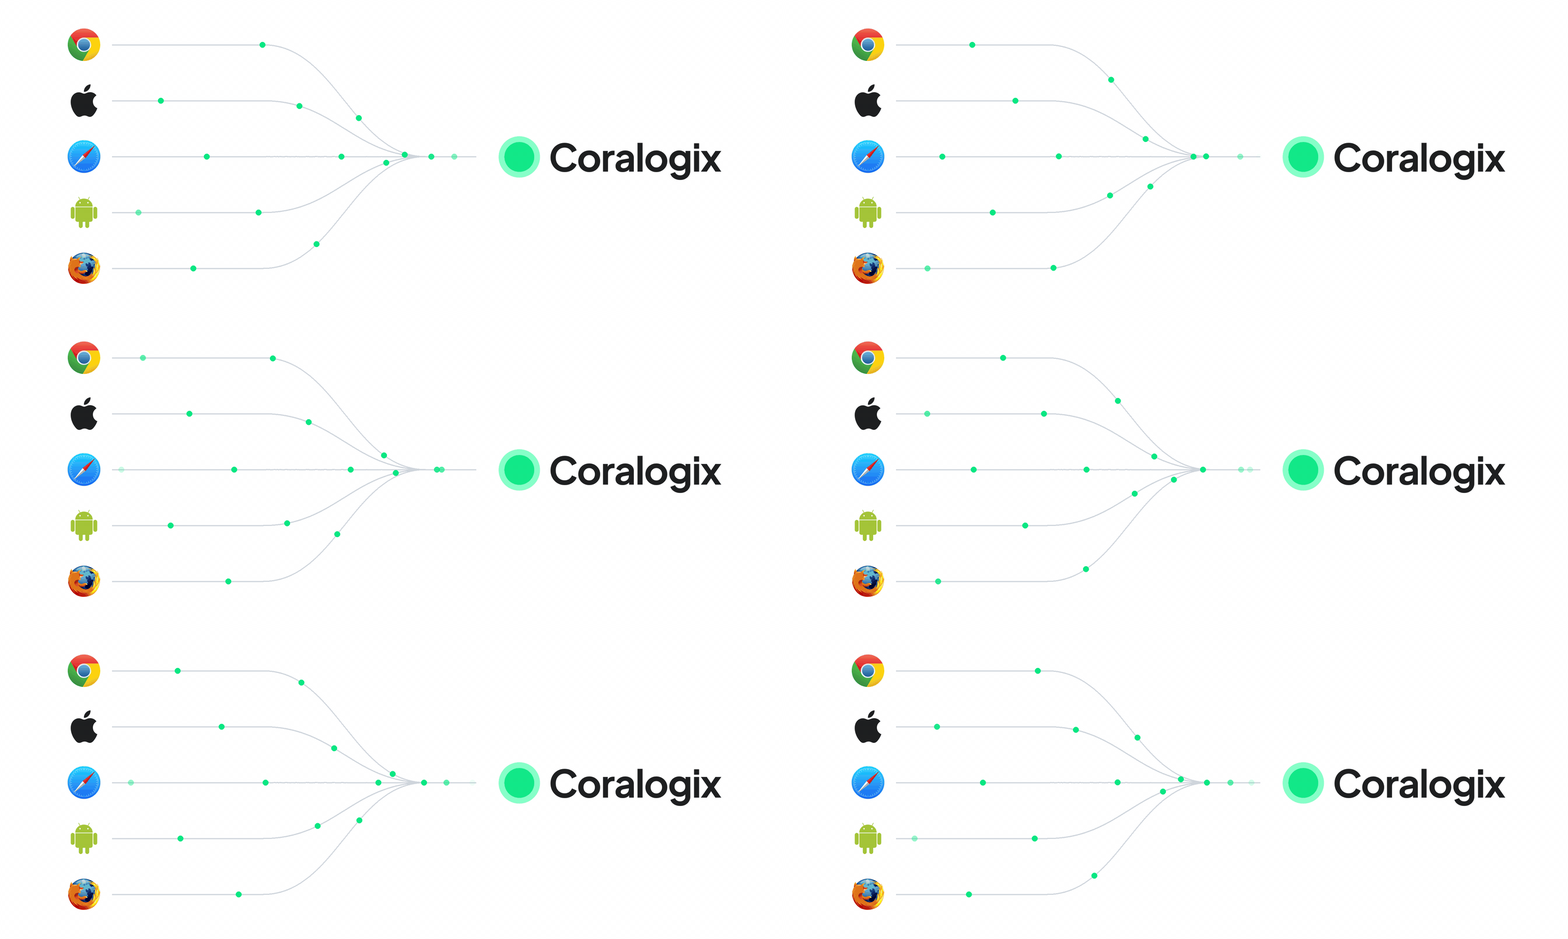
Heatmaps, funnels, and pathways, on the RUM data you already send.