
Track impact analysis automatically
Automatic impact analysis, by tracking every dependency of a service, database or API. No more guesswork.


For fast, accurate tracking
Automatically track the connections between every service, database and 3rd party API. When something goes wrong, Coralogix Dependencies tells you what happened, why it happened, and what is the impact.
Automatic impact analysis, by tracking every dependency of a service, database or API. No more guesswork.

Seeing the hidden, complex, transitive relationships that exist within and between your services.

Go beyond service maps and see how your business logic fits together. Cut MTTR with transaction by transaction insights.
See every external call your services make. From payment gateways to analytics SDKs, understand which APIs you rely on and how they affect your performance and uptime.
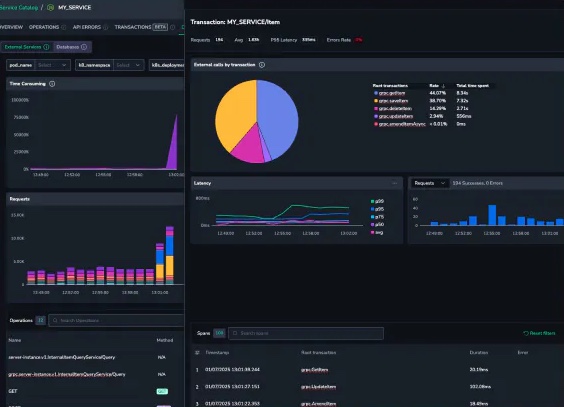
See more than query failures. Understand every transaction, in every service that directly or indirectly depends on your database, and instantly measure the impact of a slow query or poorly indexed table.
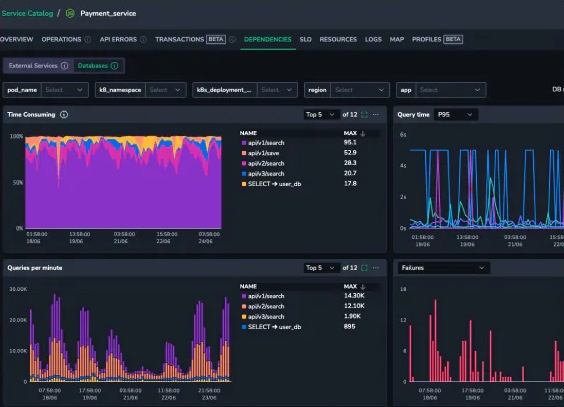
Harness the Streama© engine in Coralogix to trace every service, database, and third-party API. No indexing delays or bloated storage costs. Streama© intelligently routes and analyzes trace data in real time, so you can visualize even the most complex, transitive dependencies with full fidelity and zero compromises.
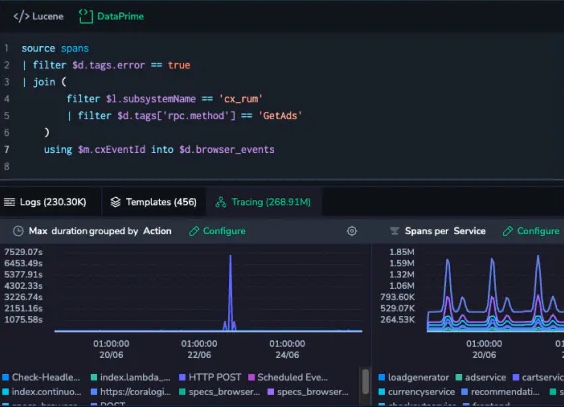
Coralogix Dependencies runs on the standard OpenTelemetry Collector, extended with a Coralogix-native plugin. You get seamless integration with your existing observability stack, no custom agents, no lock-in. Unlock powerful, real-time insights into service connections, root causes, and impact across your architecture.
Continuous, real-time monitoring of AI interactions, detecting risks and performance issues before they impact users.
Learn moreArchives all system logs indefinitely, enabling deep historical audits and preventing data gaps without ballooning storage costs.
Learn moreTransforms any incoming data for advanced querying, revealing hidden patterns without manual preparation or complexity.
Learn moreEnables rapid searches across your infrastructure data, eliminating indexing overhead and cutting operational expenses instantly.
Learn more
Application Performance Monitoring (APM) tools track throughput, response times, and error rates. They follow each request through distributed tracing and connect those signals to logs and real user...
Read now
Why Is APM Important? The primary purpose of application performance monitoring is to provide real-time...
Read now
The fastest postmortems usually trace back to one small thing: a log line that already...
Read now AI ready at scale
Run your agents and teams on the right foundation, so they don't approximate, they know
14 days, all features, no credit card required.