

What Is OpenTelemetry? A Guide to the OTel Framework
Learn what OpenTelemetry is, how its SDKs and Collector standardize traces, metrics, and logs, and why you still need a backend.
eugene evdokimov10 min read
OpenTelemetry (OTel) is an open-source observability framework, hosted by the Cloud Native Computing Foundation (CNCF), that standardizes how your applications generate, collect, and export telemetry data such as traces, metrics, and logs. The instrumentation stays vendor-neutral, so you can instrument a service once, send its telemetry to the observability tool your team uses today, and point it at a different tool next year without touching application code.
This guide covers the problem OTel was built to solve, the signals and components that carry your data to a backend, and how OTel compares with proprietary agents on portability and cost.
The Problem OpenTelemetry Was Built to Solve
Before OTel, every observability vendor shipped its own instrumentation libraries, and switching vendors meant ripping those libraries out of your code and replacing them.
Two open-source projects, OpenTracing and OpenCensus, set out to make instrumentation vendor-neutral. OpenTracing offered vendor-neutral tracing application programming interfaces (APIs) under the CNCF, while OpenCensus grew out of Google's internal Census libraries and covered metrics and tracing. Running two similar standards side by side confused developers, and library maintainers had no clear answer on which one to integrate.
The two communities merged in 2019, and the founders described OTel as the next major version of both predecessors, with a migration path for existing OpenCensus users. Maintainers archived the OpenCensus repositories in July 2023. OpenTracing has been archived for years, and the OTel specification has now deprecated its OpenTracing compatibility requirements. Any team still running either is on unmaintained code.
What OpenTelemetry Includes and What It Leaves Out
OpenTelemetry is an instrumentation standard plus the tooling to implement it. The tooling includes a specification, APIs, language software development kits (SDKs), semantic conventions, instrumentation libraries, a wire protocol, and the Collector. OTel is vendor- and tool-agnostic, so the same instrumentation works with open-source backends like Jaeger and Prometheus and with commercial products. You learn one set of APIs and conventions, and you own the data you generate.
OTel leaves out storage, querying, visualization, and alerting, the parts of an observability tool your team works in day-to-day. By design, those jobs belong to a backend, and OTel's role ends once it delivers the data there. Deploying OTel without a backend gives you plumbing with nothing at the end of the pipe.
The Three Telemetry Signals OpenTelemetry Handles
OTel treats traces, metrics, and logs as its core signals, and a fourth signal, profiles, is still in development. Handling all three in one framework means they share context. The same trace IDs that link spans together can also tie a log line to the request that produced it.
1. Traces
Distributed tracing follows a single request across every service it touches. Each operation is a span, a unit of work with a name, timing data, and attributes, and a trace is one or more spans connected through parent/child relationships. Context propagation carries the trace ID and span ID across process and network boundaries so that downstream spans join the same trace. When a checkout request slows down, the trace shows you which downstream call absorbed the latency.
2. Metrics
OTel captures metrics at runtime, such as request counts, error rates, or CPU usage, and aggregates them into separate time series for each set of attributes. The metrics API and data model are stable, and OTel's design supports interoperability with Prometheus.
Since Prometheus 3.0, the server can natively receive metrics over the OpenTelemetry Protocol (OTLP) through its built-in OTLP receiver on /api/v1/otlp/v1/metrics once you turn on the --web.enable-otlp-receiver flag. Prometheus 3.0's UTF-8 support also stores OTel metric names without rewriting dots as underscores.
3. Logs
Logs are the timestamped event records your systems emit, and the logs signal reached stable status in the specification after traces and metrics did, though SDK maturity still varies by language. OTel SDKs can also inject the active trace ID and span ID into each log record, which lets your on-call engineer move from an error log straight to the trace that produced it.
The Core Components of OpenTelemetry
Four components handle telemetry flow between your code and your backend. Instrumentation produces telemetry through APIs and SDKs or through agents that need no code changes. The Collector processes that telemetry, and OTLP carries it over the wire.
1. APIs and SDKs
The API defines the instrumentation interface, and the SDK implements it with providers, processors, and exporters. API calls do nothing until an application installs and configures an SDK, so library authors can depend on the API alone without affecting applications that never initialize OTel.
Maturity differs by language and signal, and the language status table marks traces stable in C++, .NET, Erlang/Elixir, Go, Java, JavaScript, PHP, Python, Ruby, and Swift, while Rust tracing remains in beta. Only C++, .NET, Java, and PHP list all three signals as stable.
2. Auto-Instrumentation
Zero-code instrumentation adds the API and SDK to your application as an agent, using bytecode manipulation, monkey patching, or extended Berkeley Packet Filter (eBPF) depending on the language. The Java agent attaches to any Java 8+ application and injects bytecode that captures inbound requests, outbound Hypertext Transfer Protocol (HTTP) calls, and database calls in frameworks like Spring.
Python's agent auto-instruments Flask and Django, the Node.js package covers Express, and .NET instruments ASP.NET Core, while the Kubernetes Operator can inject agents for .NET, Java, Node.js, Python, and Go. Agents stop at library boundaries, so business logic such as a fraud check or pricing calculation still needs manual spans.
3. The OpenTelemetry Collector
The Collector is a vendor-neutral binary that receives, processes, and exports telemetry, and its pipeline architecture chains receivers, processors, and exporters. Receivers accept data in formats like OTLP, Jaeger, and Prometheus, processors filter, sample, batch, or redact it, and exporters send it onward. The last processor hands data to a fan-out consumer, and each exporter gets a copy, which lets one Collector feed two backends at once during a migration.
You can run the Collector as an agent beside each workload, as a gateway behind a load balancer, or as both tiers together. Running a Collector on every node turns configuration into fleet work, and Coralogix Fleet Management pushes Collector configuration remotely over the Open Agent Management Protocol (OpAMP).
4. The OTLP Wire Protocol
OTLP is the wire protocol that encodes telemetry as Protocol Buffers and moves it between SDKs, Collectors, and backends. The OTLP specification, version 1.11.1, defines transport over gRPC on port 4317 and HTTP on port 4318, with HTTP payloads in binary protobuf or JavaScript Object Notation (JSON), and marks traces, metrics, and logs as stable.
Any backend that speaks OTLP can accept your data without a custom exporter. Some backends still recommend routing through a Collector or their own agent in production, so check each vendor's ingestion docs before you point SDKs at a backend directly.
OpenTelemetry vs. Proprietary Instrumentation
OpenTelemetry trades vendor-specific depth for portability, while proprietary instrumentation does the reverse. A proprietary vendor agent ties your instrumentation to one vendor's data format, so switching backends becomes a re-instrumentation project. With OTel, you instrument once and route to any OTLP-compatible backend.
OpenTelemetry reached CNCF graduated status in May 2026 and ranks second in project velocity among more than 240 CNCF projects, behind only Kubernetes. Adoption has followed, with 49 percent of respondents to a 2025 cloud native survey reporting OTel in production.
Proprietary agents still hold advantages, and mixing them with OTel carries integration risks:
- Feature access: Pairing the OTel API with a vendor's own SDK can expose vendor-specific features that the OpenTelemetry SDK alone doesn't.
- Agent overlap: Running a vendor agent alongside OTel can produce duplicate spans or conflicting sampling.
- Language coverage: OTel's zero-code coverage can be thinner in some languages than a mature vendor agent's.
If portability across backends matters more to your team than one vendor's extra features, OTel is the stronger default.
How OpenTelemetry Fits into Your Observability Stack
In a typical OTel pipeline, your application emits spans, metrics, and log records through an OTel SDK or agent, and the SDK exports them over OTLP to a Collector. The Collector filters, enriches, and batches them, and exporters deliver them to one or more backends. Your backend handles storage, querying, dashboards, and alerting, and open-source backends such as Prometheus and Jaeger sit in that layer alongside commercial platforms such as Coralogix.
Small development setups can skip the Collector and export straight from the SDK. Skipping the Collector costs you code changes whenever ingestion needs shift, tight coupling between application code and backend storage, and a limited set of exporters per language. A Collector between your services and backends lets you switch backends without changing instrumentation, avoiding observability vendor lock-in.
Is OpenTelemetry Free to Use?
OpenTelemetry itself is free. Its repositories ship under the Apache License 2.0, and the CNCF hosts OpenTelemetry, so you pay nothing to download, run, or modify the SDKs, agents, or Collector.
Your costs come from the backend that receives the data, whether that's a hosted vendor bill or the compute and storage behind a self-hosted stack. Collectors add infrastructure costs, plus the engineering time to configure and maintain them.
You can cut backend costs by filtering and sampling in the Collector, or by routing each data stream to a lower-cost tier. The Coralogix TCO Optimizer assigns each data stream by policy to the Frequent Search, Monitoring, or Compliance pipeline, so logs you keep only for audits don't carry search-tier pricing. You keep every signal and pay for each one based on how your team uses it.
What Happens After Your Telemetry Leaves the Collector
OTel standardizes how telemetry is generated and transported, but its job ends at the edge of your backend. During an incident, the backend decides what your team can learn through how it stores, correlates, and retains the data. A backend worth choosing offers OTLP ingestion across all three signals, long-term retention to compare today's behavior against past baselines, and cross-signal queries that don't force you to switch tools.
If you need all three capabilities in one backend, Coralogix is built for that. Coralogix, a cross-stack observability platform, is 100 percent OpenTelemetry-native with OTel-native ingestion and no proprietary agent, and Streama© writes your telemetry to your own cloud bucket in open Parquet.
Explore the Coralogix platform to see how it correlates OTel logs, metrics, and traces in one place. A free 14-day Coralogix trial with an eight-unit quota and no credit card required lets you point your Collector's OTLP exporter at it.
Frequently Asked Questions About OpenTelemetry
What is telemetry in software observability?
Telemetry is the data a system emits about its behavior, usually as traces, metrics, and logs. Engineers use it to answer whether a service is healthy, where a request slowed down, and which error fired first. OpenTelemetry instruments your code to produce that data in a standard format.
Who maintains OpenTelemetry?
The CNCF hosts OpenTelemetry. An elected Governance Committee sets strategy, and a Technical Committee owns specification and technical decisions. Contributors come from major cloud providers, observability vendors, and other companies.
What languages does OpenTelemetry support?
Official SDKs cover C++, .NET, Erlang/Elixir, Go, Java, JavaScript, Kotlin, PHP, Python, Ruby, Rust, and Swift. Stability differs per signal, and the project status page shows Python's logs SDK in development, Go's logs SDK at release candidate, and Kotlin in development for all three signals.
Does OpenTelemetry replace existing monitoring agents?
Partly, OTel can take over a vendor agent's instrumentation and shipping role, but it doesn't replace your backend. Swapping agents one service at a time limits the impact of a bad instrumentation change. Running a vendor agent and OTel on the same service can produce duplicate spans, so keep each service on one or the other.
Keep reading
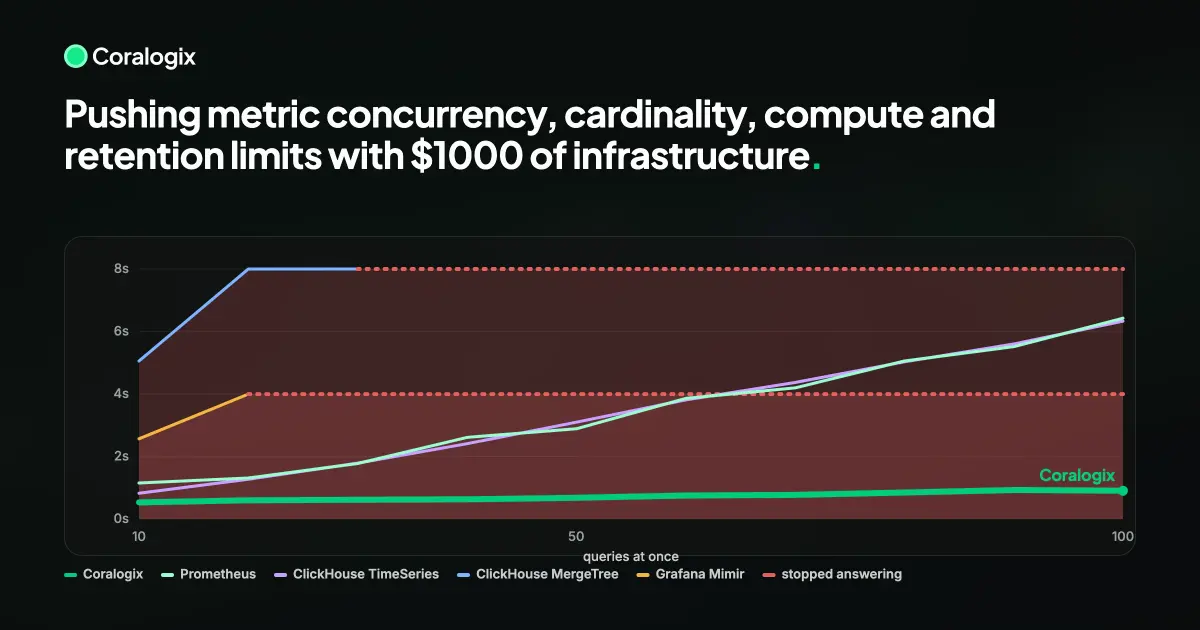 MetricsPushing metric concurrency, cardinality, compute and retention limits with $1000 of infrastructureFive metrics backends, same budget and data, under rising concurrency. At low load the open source engines looked strong; under load, two stopped answering.
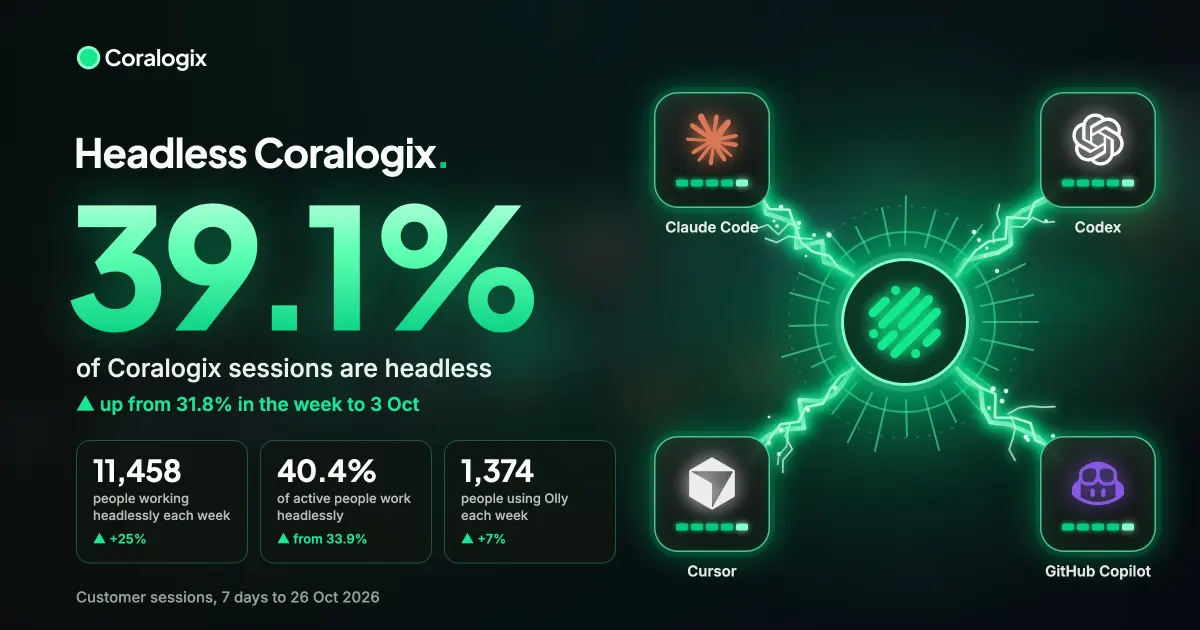 AI39% of Coralogix sessions are now headless39% of Coralogix sessions now run through Olly, the CLI or MCP. See how headless use is growing, what coding agents query, and what makes it work.
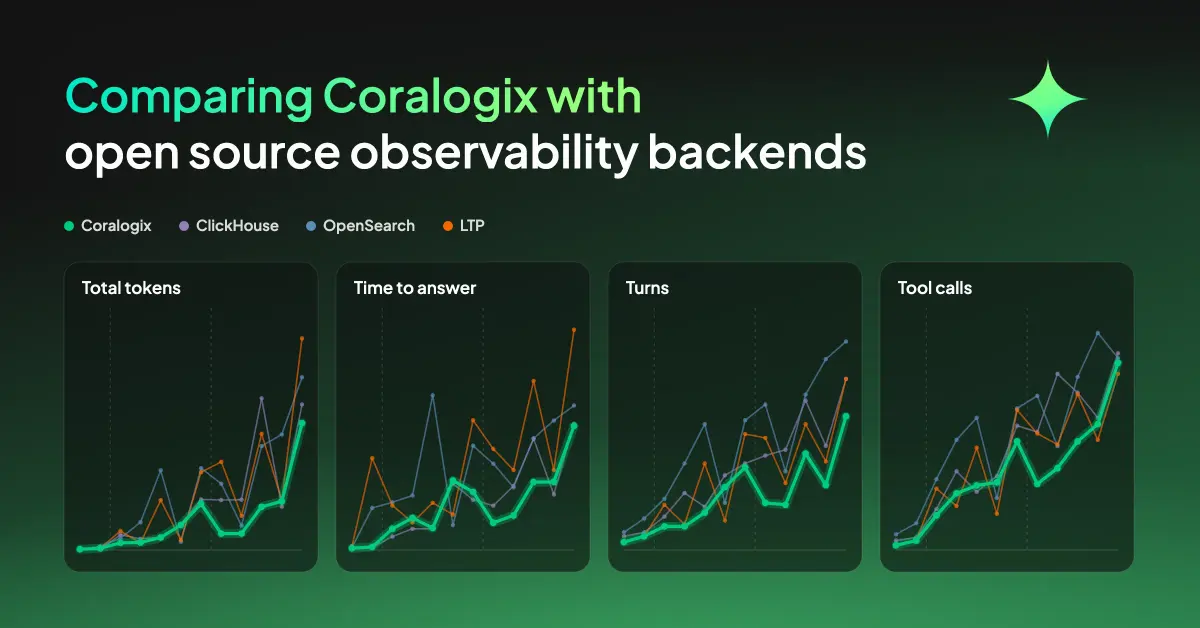 AIComparing Coralogix with open source observability backendsWe gave one agent the same OpenTelemetry data in four backends. Ambiguous requests cost 46 times more, and a schema fixed at ingest is why.