Manage dashboard settings
Overview
The settings panel gives you centralized access to key dashboard options. You can rename your dashboard, edit its description, assign a slug, lock it from changes, and choose where it appears in your dashboards list-all in one unified place. To learn more about creating and using dashboards, see the Custom Dashboards overview.
You can access the settings panel from:
- The more actions menu in the upper-right corner of the dashboard.
- The more actions menu that appears when you hover over a dashboard in the DASHBOARDS LIST on the left.
With view and edit modes, Dashboard settings is inactive in the dashboard's more actions menu while the dashboard is in view mode. Switch to edit mode to open it, or reach the panel from the DASHBOARDS LIST.
The panel includes two sections:
- General settings: System-level options that affect the dashboard itself, such as setting the title and description.
- User preferences: Personal settings that affect how you interact with the dashboard.
Saving behavior
To save dashboard settings like title, description, or slug, select Apply, and then Save in the dashboard header. Selecting Apply alone doesn’t save these changes. User preferences, however, are saved to your dashboard immediately when you select Apply.
When you open dashboard settings from the DASHBOARDS LIST, all changes to both general settings and user preferences are saved directly to that dashboard when you select Apply. No additional save is required.
User preferences are not available when creating a new dashboard. You’ll need to save the dashboard first to access them.
Save changes in edit mode
This feature is available for early-access customers. To request access and confirm your organization meets the feature criteria, contact your account representative or Support.
With view and edit modes, Save changes appears only in edit mode, at the right of the dashboard header, showing the number of pending changes. Press Cmd+S (MacOS) or Ctrl+S (Windows) to open the same dialog in edit mode.
The Save changes button opens a dialog listing every pending change. Each row names the change, its Type, and the Action made, which is Added, Removed, or Modified. A single action can produce more than one row.
Most changes are saved for everyone who opens the dashboard, so their checkboxes are selected and locked. Widget changes, access policy changes, and control configuration all work this way.
Changed control values are the exception. They carry the type Default value, show the stored value next to the one you picked, and have their checkboxes cleared. Select one to make your value the new default, or leave it cleared and the value stays in your view, carried only by the page URL. See What you can change in view mode.
Changes counts everything pending; the count on Save counts only what's selected, so the two differ whenever a control value stays cleared.
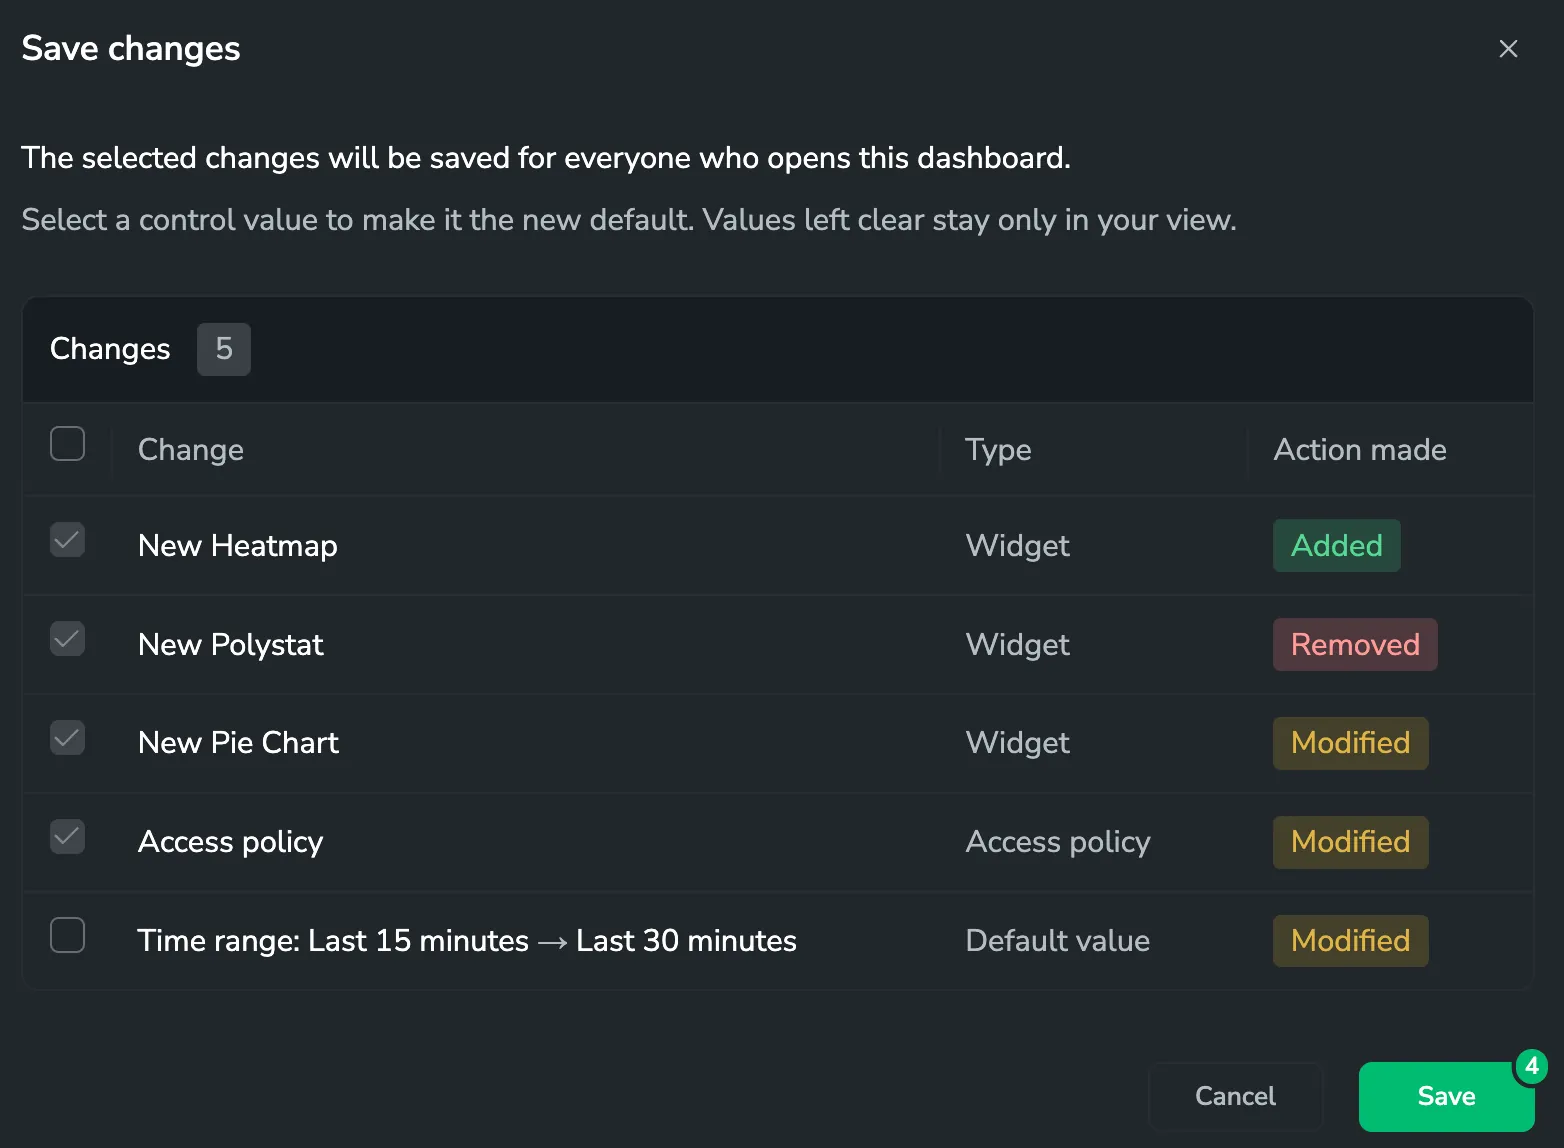
Save writes exactly what's selected. After the save, the dashboard returns to view mode, and the version you saved becomes the baseline that Revert compares against.
Cancel closes the dialog without saving. Any changes you made to the dashboard or widgets remain.
Revert changes in edit mode
Revert, in the dashboard header, returns the dashboard to its last saved state. In edit mode that covers widgets and control configuration too, so it discards editing work, not just your own view. See Revert to saved version for how the same control behaves in view mode.
Leave edit mode with unsaved changes
Selecting View with unsaved widget or configuration changes asks you to confirm discarding them. Confirming restores the saved structure and returns you to view mode, and your control values stay as they were. With nothing pending, selecting View returns you to view mode with no prompt.
Switching to another dashboard or leaving the page with unsaved widget or configuration changes offers Discard changes, or Save and exit, which opens the Save changes dialog. Closing the prompt keeps you in edit mode with every change intact.
Title
You can rename your dashboard at any time. Use a clear and descriptive name that makes it easy to locate in the DASHBOARDS LIST. New dashboards are named New Dashboard by default. To rename it, select the title and enter a new name.
With early access to naming and placement on first save, a new dashboard has no default name. You name it and select its folder in the Save dashboard dialog the first time you save it. See Name and place a dashboard on its first save.
Dashboards saved from Visual Explorer are automatically titled Visual Explorer, followed by the date and time of the save-for example, Visual Explorer - 15/07/25 09:37:09.
Description
The description provides a short summary of the dashboard's purpose or the insights it provides. It appears in the dashboard tooltip to help viewers quickly understand the context.
Folder
Assign the dashboard to a folder to organize it in the DASHBOARDS LIST. Folders make it easier to group dashboards by team, environment, use case, or ownership. You can change the folder assignment at any time.
With early access to naming and placement on first save, you select the folder in the Save dashboard dialog when you first save the dashboard, and change it here afterwards.
Dashboard slug
A slug is a custom URL-safe name that you can assign to your dashboard. This is useful when:
- Referencing your dashboard programmatically.
- Sharing your dashboard as a link.
- Building custom actions that target a specific dashboard.
- Navigating between duplicate dashboards across multiple teams, by using the same slug and simply replacing the team name in the URL.
If you select Share dashboard URL in the dashboard's more actions menu, and a slug has been set, the slug replaces the dashboard ID in the URL path following /dashboards/. For example: https://company-team-1.coralogix.com/#/dashboards/s/my-dashboard-slug.
The slug metadata is not included when exporting and importing a dashboard.
To learn more about sharing dashboards, widgets, and sections, see Share Dashboard Content.
Slug requirements
- Slugs must be unique within your team.
- Only lowercase letters, numbers, hyphens (
-) and underscores (_) are supported. - Spaces and special characters are not supported.
- Slugs can’t begin or end with hyphens (
-) or underscores (_).
System metadata
A tooltip next to the dashboard title displays metadata including, the dashboard's description, creation date, and last modified date.

The tooltip automatically updates when a dashboard is changed.
A dashboard can be created or modified either by a user through the Coralogix UI or via external API actions. If a team-level API key is used, the key name will be shown as the creator or modifier in the dashboard tooltip.
User preferences
Star dashboard
Mark the dashboard as a favorite to pin it to the top of your dashboard list.
Set as default dashboard
Make this your home dashboard, shown by default when you open Custom Dashboards.
Turn the toggle off and select Apply to clear it again. Coralogix confirms with Default dashboard unset, and opening Custom Dashboards takes you to the catalog rather than to a dashboard.
Lock dashboard
Locking a dashboard prevents unauthorized modifications while preserving its current state.
Locking prevents others from making changes to the dashboard layout or its widgets. When a dashboard is locked, a padlock icon appears next to its title. To unlock it, return to the settings panel and toggle Lock dashboard.
Lock behavior
- Users must have the
TEAM-DASHBOARDS:UPDATEpermission to lock or unlock a dashboard. - Only the dashboard creator can lock or unlock it.
- Locking records the user who performed the action in the dashboard metadata.
- With view and edit modes, locking or unlocking writes only the lock status. Changes pending in edit mode remain pending until you save or revert.
- If a dashboard was created using a team-level API key, any team member can lock it.
- For older dashboards without an assigned creator, any team member can lock them.
- If you want to edit a locked dashboard but lack the necessary permissions, you can duplicate a dashboard by selecting Make a copy from the 3-dot menu next to the dashboard name in the Dashboards List.
Locking dashboards helps protect critical dashboards from accidental changes while still allowing team members to duplicate them when edits are needed.
Widget edit mode
This feature is available for early-access customers. To request access and confirm your organization meets the feature criteria, contact your account representative or Support.
With view and edit modes, the dashboard's mode governs its widgets: the controls described below are hidden in dashboard view mode and reappear in edit mode.
In explicit edit mode, widgets stay in view mode by default. To make changes to a widget, first switch it to edit mode, either by selecting the pencil icon in the widget's toolbar or Edit mode from its more actions menu. A widget in edit mode is outlined in green and shows its settings panel. To leave edit mode, select the eye icon in the toolbar, or View mode from the more actions menu. This prevents accidental edits when navigating dashboards.
Widget menu options
When explicit edit mode is enabled, the widget's more actions menu includes:
| Option | Description |
|---|---|
| Edit mode / View mode | Toggles the widget between view mode and edit mode. The menu shows whichever action applies to the widget's current state. |
| Add description | Adds or edits a description shown in the widget header. |
| Delete | Removes the widget from the dashboard. |
| Clone | Creates a copy of the widget in the same dashboard. |
| Share widget URL | Copies a link that opens the dashboard focused on this widget. |
| Export as CSV | Exports the widget's current data to a CSV file. See Export widget data to CSV. |
| Legend settings | Opens legend configuration for the widget. |
| Add to investigation | Adds the widget to an active Coralogix investigation. |

Access policies
Access policies let you specify exactly who can view or manage your dashboard. Set a default access level for everyone in your team, then override it for specific groups as needed.
Use it to:
- Keep a dashboard visible to only you
- Allow team-only access for a specific group
- Grant access to everyone except specific groups
Create a policy
For configuration examples (private, team-only, everyone-except-group, read-only with selected managers, and more), see Access policies → Configuration examples. For the full model, including permissions, restricted-group behavior, and FAQs, see policy-based access control.
Read-only dashboards
To make a dashboard read-only for a group, set its resource access level to Dashboard: Read instead of Dashboard: Manage, in a target group rule or in General access. Members of that group can view the dashboard but not edit it.
Read-only access applies per dashboard, not per user. To make additional dashboards read-only for the same group, configure an access policy on each of those dashboards.
By default, read-only viewers can still explore the dashboard interactively (adjusting filters, variables, and the time range) without saving their changes. To restrict them to changing only the time range, turn on Allow only time filters on the rule. Variable and filter controls are then disabled for those viewers; only the time range remains interactive.
Read-only is a dashboard-level restriction, not a data-scoping control. It limits how a group interacts with this dashboard only. It doesn't restrict what those users can access elsewhere in Coralogix (such as Explore), which is still governed by their role-based and policy-based permissions.
Policy permissions
To delegate who can administer this dashboard's access policy, turn on the Policy permissions toggle in the Access Policy panel. See Policy permissions.
The Policy access level applies only together with access to the dashboard. A group with Policy: View also needs Dashboard: Read, and a group with Policy: Edit also needs Dashboard: Manage.
A user who can manage access policies across the account, but can't read this dashboard, sees a lock badge, You can only manage this dashboard's access policy, and can open the policy from Settings.
Next steps
Learn how to share dashboard content.