Data usage metrics
Data usage metrics turn your data usage into three Prometheus metrics. Once they exist, your consumption is queryable like any other metric, so you can chart it on a custom dashboard, alert before you burn through a daily quota, and attribute spend to an application, a subsystem, or a TCO priority.
What you need
Three things have to be in place before usage data appears. The product checks all three and tells you which is missing when you open the Usage & Quota page.
| Requirement | Why |
|---|---|
| An S3 metrics bucket | Usage data is stored there. Without it, the metrics toggle stays disabled. See Connect an S3 archive. |
| Data usage metrics enabled | Produces the three metrics. See Data Usage settings panel. |
| The Coralogix System Monitoring extension | Provides the Data Usage dashboard that charts the metrics. See Extensions. |
You can use the metrics without the extension by building your own dashboards and alerts. The extension matters when you want the ready-made Data Usage dashboard rather than starting from an empty one.
Enabling metrics starts an auto-populate process covering the previous 24 hours. It can take up to two hours before data appears.
The metrics
| Metric | What it reports |
|---|---|
cx_data_usage_units | Units consumed |
cx_data_usage_bytes_total | Bytes sent |
cx_data_plan_units_per_day | The daily quota your plan allows |
The third is what makes the other two actionable: comparing consumption against the quota is how you express "percentage of today's quota used" in a query.
What enabling it costs
The three metrics count towards your metrics quota like any other metric, so turning them on is not free.
The cost scales with cardinality, which means it depends on how many distinct combinations of the labels below your traffic produces. An account sending logs from a handful of applications generates far fewer series than one sending from hundreds.
As a rule of thumb, 30 GB of metrics consumes 1 GB of quota. In practice the three metrics typically consume well under 100 MB of quota per day.
These figures are a guide rather than a commitment. To see the real cost for your account, enable the metrics and check your metrics usage after a full day.
Enable data usage metrics
Select Settings, then Usage & Quota under Subscriptions. Select Settings on that page, then turn on Enable metrics.
The toggle is unavailable when no S3 metrics bucket is configured, or when you lack the permission to manage data usage. For the full procedure, the permission it needs, and the related dataplan.usage_events dataset, see Data Usage settings panel.
View your usage
The Coralogix System Monitoring extension includes a Data Usage dashboard built on these metrics. It highlights your top data-sending applications and makes usage spikes visible without you building anything. To open it, select the more actions menu in the Usage & Quota header, then View Data Usage Dashboard.
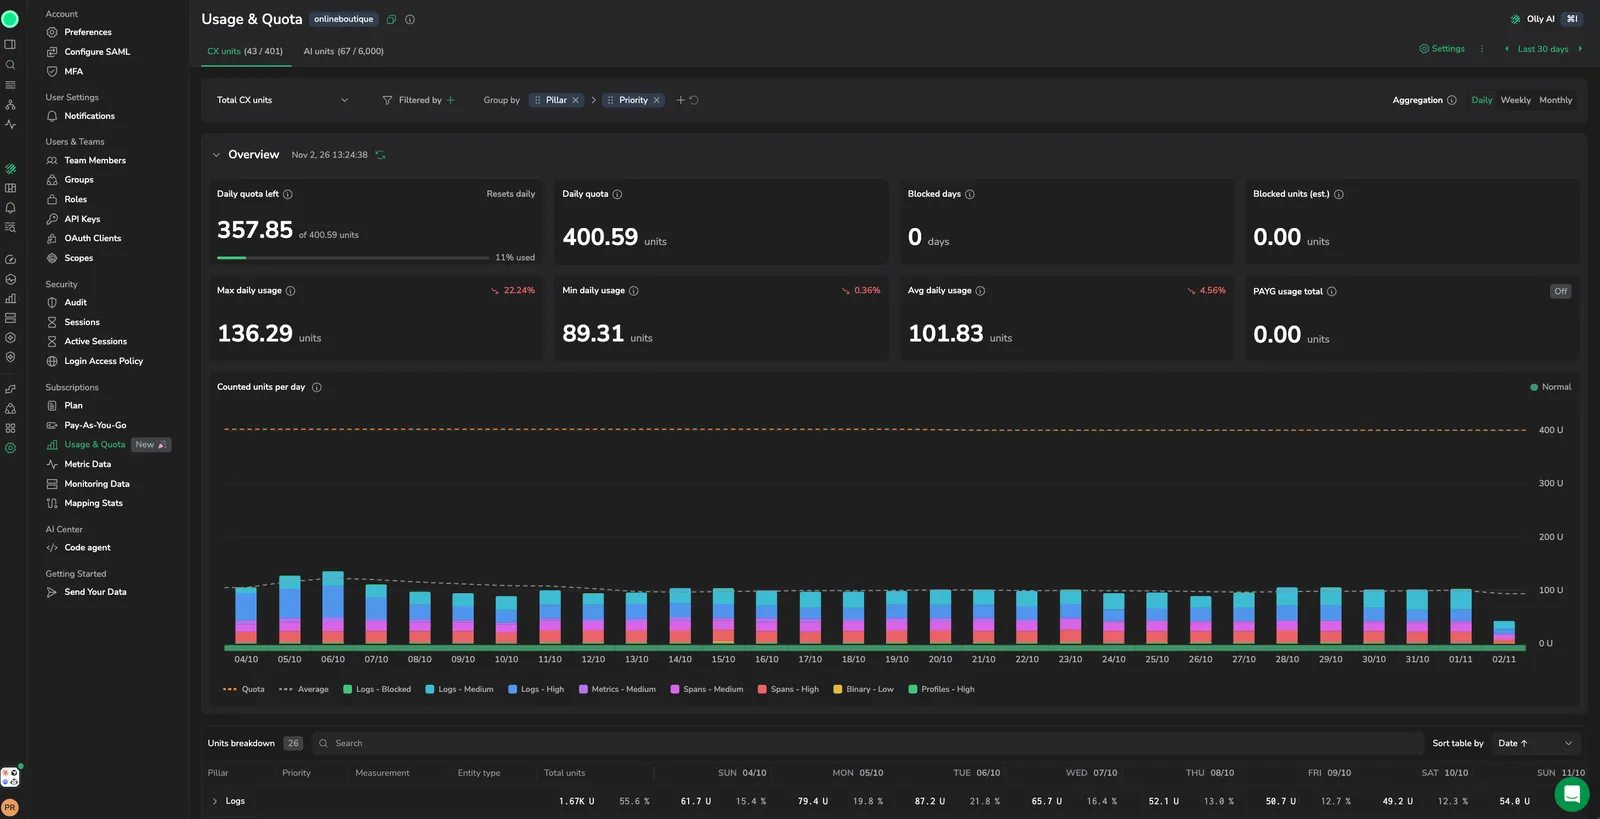
The Usage & Quota page itself charts your counted units per day against your quota, broken down by pillar and priority, with an Aggregation control for Daily, Weekly, or Monthly buckets. Reach for the metrics when you need something that page does not give you: a panel beside your own service metrics, a custom grouping, or an alert. Chart them on a custom dashboard.
Alert on your usage
Because the quota is a metric, you can alert on consumption as a proportion of it rather than on a fixed number. A metric threshold alert on this expression fires when the team passes a share of today's quota:
sum(cx_data_usage_units) / max(cx_data_plan_units_per_day) * 100
To catch a sudden spike rather than a gradual climb, alert on the rate of increase instead:
increase(cx_data_usage_units[30m])
For hard limits rather than notifications, see Quota rules.
Labels
Every data point carries the labels below. They are what you group and filter by when attributing usage.
| Label | Description |
|---|---|
pillar | Type of traffic (logs, spans, metrics) in each data point |
subsystem_name | Subsystem that generated the traffic, used by the logs and spans pillars |
application_name | Application that generated the traffic, used by the logs and spans pillars |
priority | TCO priority (high, medium, low, blocked) |
severity | Log severity (critical, error, warn, info, debug, trace), used by the logs pillar |
blocking_reason_type | Why traffic was blocked. The value is either tco_policy or parsing_rule. |
blocking_reason_name | The name of the TCO policy or parsing rule blocking the traffic |
Traffic that reaches Coralogix without an application or subsystem is reported under cx_default or cx_null rather than being dropped. Account for those values when you filter or group by application_name, or a dashboard filtered to named applications will understate your usage.
Troubleshooting
| What you see | What to check |
|---|---|
| The metrics toggle is unavailable | No S3 metrics bucket is configured, or you lack permission to manage data usage |
| You cannot find the toggle | It is behind Settings on the Usage & Quota page, not on the page itself |
| The toggle is on but no data appears | The auto-populate process takes up to two hours after enabling |
| The Data Usage dashboard is empty | The Coralogix System Monitoring extension is not deployed |
| A dashboard filtered by application shows less than you expect | Traffic with no application is reported as cx_default or cx_null |