Filter, group, and aggregate
The toolbar above the Overview scopes what the cards, chart, and tables show.
-
Select Filtered by, then add a condition to narrow the data. Conditions use the
=and!=operators.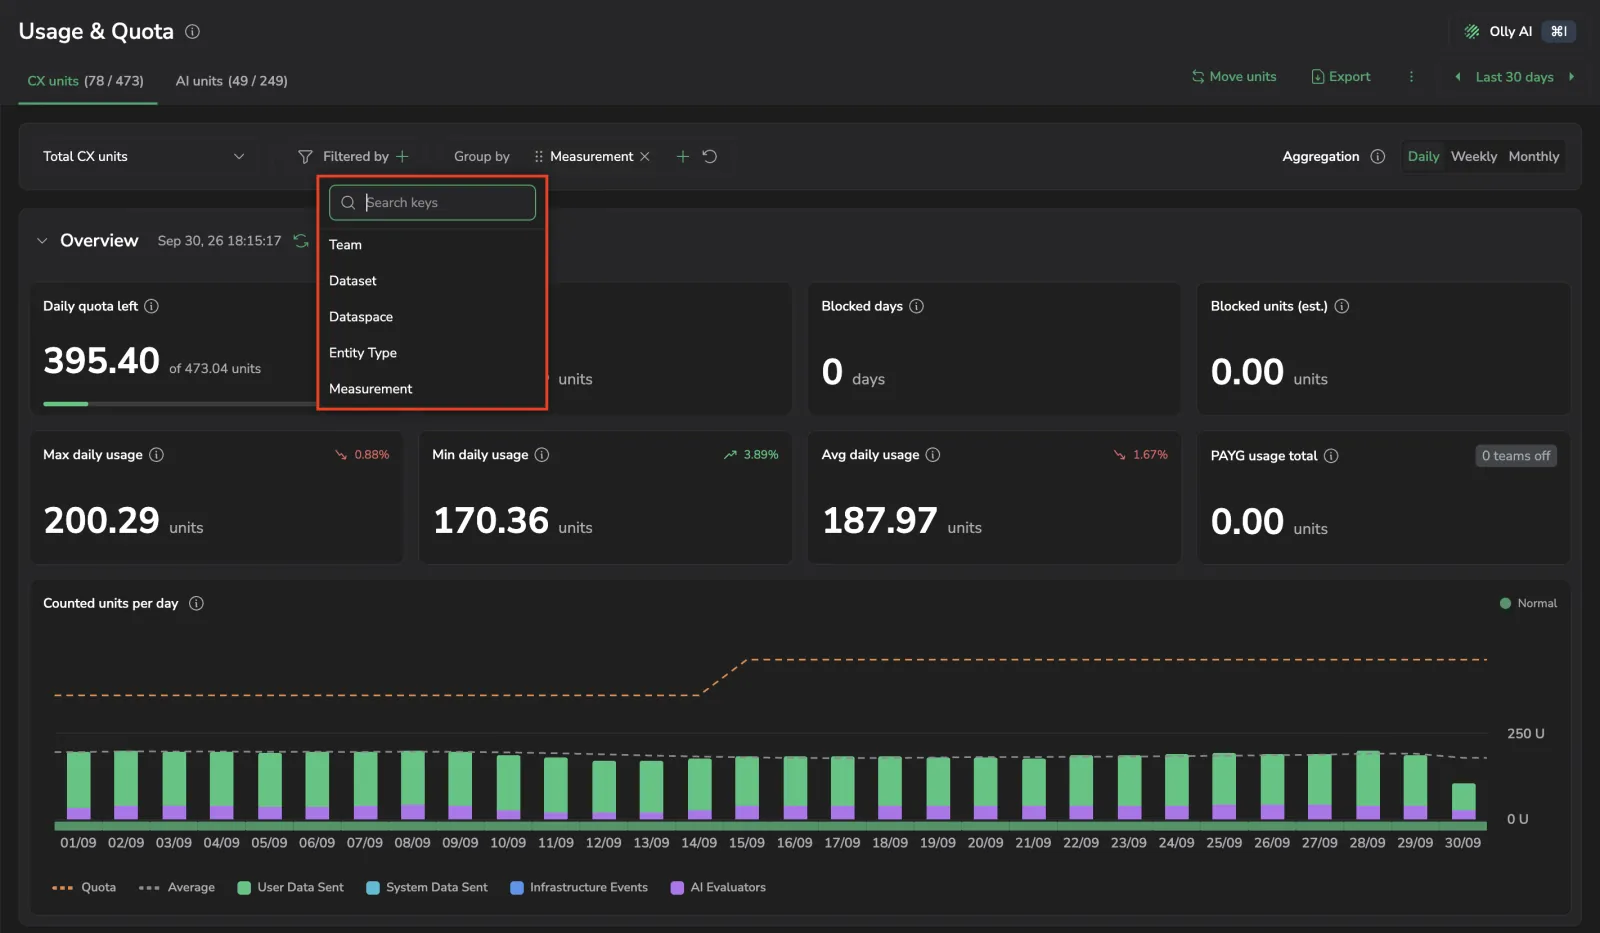
-
Select Group by, then add one or more fields. Drag the chips to reorder the breakdown. Each tab opens with a default grouping, and resetting the group-by returns to it. The fields available depend on the tab:
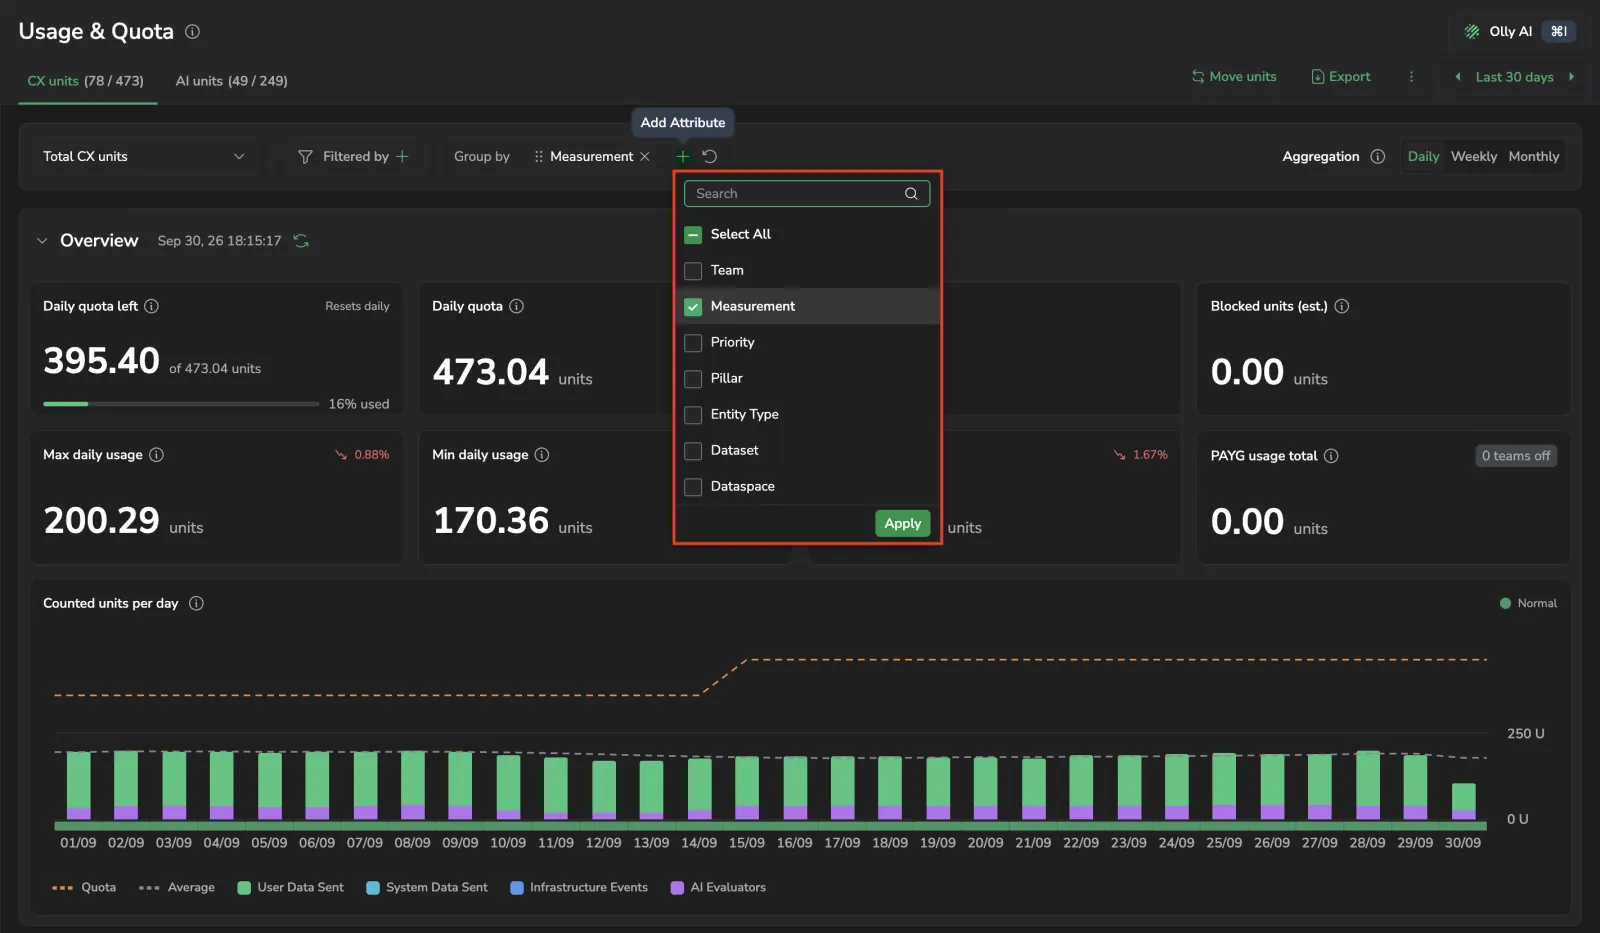 Group-by fields per tab
Tab Group-by fields Default User data sent Pillar, Priority, Entity Type, Dataset, Dataspace, Feature, Feature Group Entity Type, then Priority System data sent Pillar, Priority, Dataset, Feature, Feature Group Dataset, then Priority Infrastructure data Priority, Feature, Feature Group Priority AI units Policy, Feature Policy CX units Measurement, Priority, Pillar, Entity Type, Dataset, Dataspace, Feature, Feature Group Pillar, then Priority Feature and Feature Group break usage down by the Coralogix feature that metered it, for example to separate backfilled data from regular ingestion. Both are also available as Filtered by fields on the same tabs. While either one is grouped, the usage table splits its rows per feature and adds a matching column. Usage with no named feature or feature group appears as Unknown. On the AI units tab, Feature applies to AI Center policies, and Feature Group is not offered.
-
Choose an Aggregation of Daily, Weekly, or Monthly.
Aggregation groups raw daily usage into larger time buckets. Each bar in the chart is the sum of every day in its bucket, so a 90-day range shown weekly draws roughly 13 bars instead of 90. The underlying data does not change, only how it is bucketed, and totals stay the same across all three settings. Weekly and Monthly are unavailable when the selected range is shorter than the bucket they would create.
-
Set the time range from the time picker. Choose a preset or a custom range, up to 365 days. The page opens on Last 30 days.
In the organization view, two extra controls are available:
- Team as a group-by field, added to the top of the list on every tab except Infrastructure data, where series are named by priority. It draws one chart series per team. Combined with another field, series are named
<team> - <field>. - Pay-As-You-Go as a filter field, with the values On and Off. It narrows the cards, the chart, and the table together.